
|
|
|||||
|
|
|||||
|
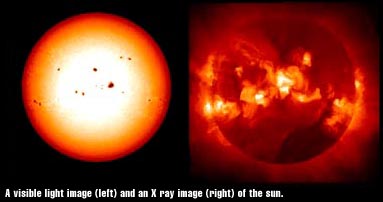
There are many mysteries about sunspots still to be solved. As stellar physicist David Dearborn notes, "Scientists love mysteries. When you solve something, then it becomes a lot less interesting, and you go find another question to ask." Scientists are trying to learn more about sunspots. One method scientists use is comparing images of different types of light or radiation, and examining the relationship between the two pictures. In this activity, you will compare visible light images of sunspots with images that show x-ray emissions from the same time period. |
|
So an ordinary, white-light photograph
captures light radiation from the visible spectrum, showing the
dark areas where sunspots are concentrated. An x-ray captures high-energy
radiation normally invisible to the human eye (like the light used
to make medical X-rays).
|
|
|
|
||
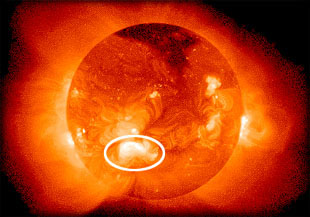
| These small "x-ray bright spots" occur sporadically all over the sun (so they are not indicators of active regions). For more information on the loops, plumes, and various other features you see in x-ray images, you can go to this archive of Yohkoh images. | |||
|
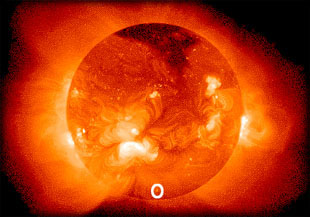
Will the dark areas of high sunspot activity visible in white light images correspond to the bright areas of active regions visible in the x-ray images? Scientists are still uncertain about this relationship. According to Fischer, "Even thought it's known that the area of sunspots group is roughly proportional to the amount of x-rays coming out of an active region, no one, as far as I know, has actually compared them." You can help figure out this relationship, by gathering and comparing real data about sunspots and solar x-ray activity Like the great astronomer Galileo, you will measure the size of sunspots. But unlike Galileo you won't have to view the sun directly. You'll compare visible light images and x-ray images taken on the same day from a satellite orbiting high above the earth. These images are taken from Yohkoh, a Japanese telescope launched in cooperation with NASA for the specific purpose of observing the sun. The name of the telescope, Yohkoh, means "sunbeam" in Japanese. You'll have a series of images taken from one month during a solar maximum. You'll color in the active sunspot or x-ray areas using the mouse. The areas you color in will be recorded automatically in a table, and in an evolving graph of sunspot areas vs. x-ray areas. |
|
|
|||||
|
|
|||||
|
|