pointing finger animation


Locating Earthquake Epicenters

By Eric Muller

Topic:
Earth Science

Type of Web activity:
Using data from the Web

Materials / Software needed:
Web browser.

Poster-sized map of world (like from National Geographic )

Grade Level:
5-12

Time involved:

Several Weeks to Several Months

Created on:
July 26, 1996

Updated:
  August  2005


The Web Science Workshop lessons were created in cooperation with the Exploratorium Teacher Institute .


This site developed and maintained by Deborah Hunt and Eric Muller .

3601 Lyon St.
San Francisco, CA 94123

© The Exploratorium


seismograph readout

Create a map of earthquake epicenters and define plate boundaries around the world. This lesson may take a few months to complete, so be patient.


Below are two variations of this lesson: the classroom version and the individual version.

Classroom version:
1) Buy a large map of the world and a box of push pins.
2) Go to the IRIS Web site and check out earthquake that have occured Mag. 4 and above for the last 30 days
(IRIS stands for: Incorporated Research Institutions for Seismology). http://www.iris.edu/seismon/last30days.phtml

This page only presents earthquake information in text only.

3) Stick a tack in the map where an earthquake has occurred.
4) Return to the IRIS earthquake page every week and stick new pins in the map. Repeat this until a distinct pattern begins to appear.

Dynamic Earth
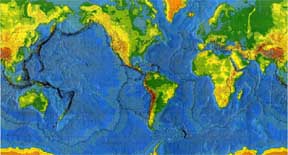
Image from the USGS showing years worth of epicenter locations.

5) Optional:

  • Use different colored pins for different earthquake magnitudes.
  • Use different colored pins to represent earthquake depth (0-100 km, 100-200 km, 200-300 km, >300km). The pattern of colors will eventually show where there are subduction zones.

Individual lessons:
1) Print a map from the link below.
Exploratorium Map information page.
2) Mark latitude and longitude coordinates on this map.
3) Go to the IRIS earthquake page .
4) Make a mark on your map whereever an earthquake has occured.
5) Repeat this every week until a distinct pattern begins to appear.
6) Optional:

  • Use different colored pins for different earthquake magnitudes.
  • Use different colored pins to represent earthquake depth (0-100 km, 100-200 km, 200-300 km, >300km). The pattern of colors will eventually show where there are subduction zones.

For more information:

  • To see what your map will eventually look like, click here.
  • For a map of earthquake for the last 7 days, 1 month or year, click here .
  • For more information on maps, click here .
  • To find out why earthquakes happen in certain locations, click here .
  • For even more information on earthquakes, click here.

and is used with permission.

Back to Web Lessons Home Page