|
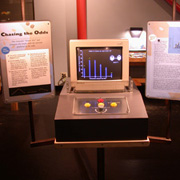
Six
bars of white race upward toward individual finish lines. The
bars are part of a histogram that shows the number of times that
a particular end result of an experiment has occurred. The visitor
may choose one of three experiments. For example, in one experiment
the computer "rolls" two dice and computes the sum.
The visitor also chooses the total number of times that the dice
will be rolled. Each time the computer "rolls" a 7,
bar number 7 advances by one towards its goal. The finish line
represents the average expected result. For example, if the visitor
chooses 360 rolls of two dice, the sum would be 7 on the average
of 60 times. The actual result of a single real experiment containing
360 rolls will seldom be sixty sevens. This exhibit lets the visitor
rapidly repeat dice rolling experiments so that they can compare
the real result to the expected result over and over again. As
the number of rolls in each experiment increases, the percentage
difference between the average and the actual results will diminish.
This exhibit is best when accompanied by the exhibit Count the
Ways in which a visitor actually rolls dice and builds the histogram
by hand. The computer extends the manual exhibit by rolling the
dice a thousand times faster than a human can roll them.
Visitors can also choose to display the difference of two dice
or even the results of rolling a single die.
The understanding of probability is one of the building blocks
of scientific experimentation.
|
|