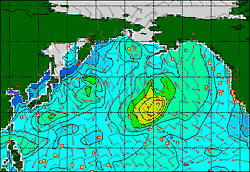
Step 4: Where are the biggest waves being generated? Are they headed toward your beach?
You can answer these questions with another wave model from NOAA. Go back to the page where you got your first wind image (the URL is below). The menu you used to select wind speeds also offers an option for wave heights. To see the wave heights generated by the storm we're tracking, we'll look at the nowcast for the north Pacific.

|
|
Click the image to see it actual size.
Print
out our other wave models:
|
At this point, you might find it helpful to print out the images you're getting and put them side by side for comparison. That will allow you to really see how wind patterns affect ocean waves. Or you can print out the images we're using as an example. The information we get about wave height from this diagram tells us that the biggest waves are being created just south of the storm's center, at about 37N latitude and 160W longitude. And we can see by the arrows that the waves are headed right for our beach.
Great! Surf's up! Or at least, it will be. But when? Ah, finding this answer is the last, and most crucial step. Again, we turn to more pictures from NOAA.
|
|